11. Debugging Source Code


This chapter describes the CodeWarrior source-level debugger. To a great extent, this debugger works for all supported chips, operating systems, and languages (C, C++, Pascal, Java, and assembly language).

A debugger controls program execution so that you can see what happens internally as your program runs. You use a debugger to find problems in your program's execution. The debugger can execute your program one statement at a time, suspend execution when control reaches a specified point, or interrupt the program when it changes the value of a designated memory location. When the debugger stops a program, you can view the chain of function calls, examine and change the values of variables, and inspect the contents of the processor's registers.


NOTE

This chapter describes the common functionality of the debugger for all platform targets. However, there may be some minor differences in the debugger's features for your particular build target. You should read the appropriate Targeting manual to cover the specific differences for your build target. For information on which Targeting manual to read, see "Targeting Documentation" on page 27.

The other topics in this chapter are:


Symbolics Files

A project's symbolics file contains information the debugger needs to debug the project, such as the names of routines and variables (the symbols), their locations within the source code, and their locations within the object code.

The debugger uses the symbolics file to display the source code that corresponds to your object code. For example, when you stop a program's execution to examine it, the debugger shows you the source code.

You can also view the corresponding assembly-language instructions and memory addresses. See "Viewing source code as assembly" on page 402 for more information.

CodeWarrior supports several different symbolics formats appropriate for a variety of build targets. Table 11.1 lists some of the supported formats:

Table 11.1 Supported symbolics file formats

Format
Principal Build Target
CodeView
Win32
DWARF
Embedded systems
SYM
Mac OS

See "Preparing for Debugging" on page 390 for information on how to set up projects and source files to create symbolics files.

For more information on compiler and linker settings, refer to "Configuring Target Options" on page 315.

To learn more about symbolics files for a particular build target, see the corresponding Targeting manual.


Preparing for Debugging

To debug the code generated by a particular build target within your CodeWarrior project file, both the build target and the individual source files within it must be configured for debugging. After the build target and source files are configured properly, CodeWarrior generates symbolics information for use by the debugger.

This section discusses the following topics:


Setting Up a Build Target for Debugging

To prepare a build target for debugging, make sure it is the active build target. Then, choose the Enable Debugger command from the Project menu. When debugging is enabled for a build target, the menu command changes to Disable Debugger. Choosing Disable Debugger turns off debugging for the build target and changes the menu command back to Enable Debugger.

The Enable Debugger command activates the debugger. When your project's target settings are correctly configured, the compiler and linker generate a symbolics file containing information for debugging at the source-code level. By default, this symbolics file is saved in the same location as the output directory.

See "Configuring Target Options" on page 315 for more information on build target settings.


NOTE

A symbolics file allows the debugger to keep track of the symbols used in your source code. See "Symbolics Files" on page 390 for more information.

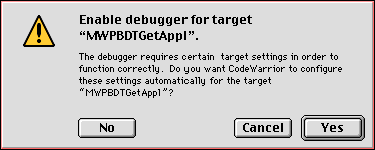
When you choose Enable Debugger, you might see an alert (Figure 11.1). CodeWarrior is reminding you that it will modify the build target settings to prepare the project for debugging. Click Yes to apply the debugging changes to your build target.

Figure 11.1 Accepting changes set by Enable Debugger


Setting Up a File for Debugging

After you enable debugging for the current build target, you have to set up your individual files for debugging. If you intend to debug your program, you typically enable debugging for all of your source files.

The Project window includes a debug column, as shown in Figure 11.2. For files, a mark in this column means that symbolic information is generated; no mark means that symbolic information is not generated. For group names, a mark indicates that debugging is enabled for every file in the group and no mark means that debugging is disabled for one or more files in the group.
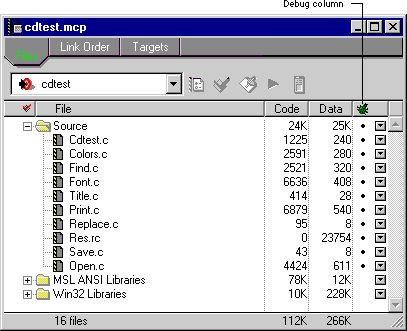
Figure 11.2 Setting debugging in the Project window


To toggle debugging for a file, click in the Debug column for that file. Clicking in the Debug column for a group name enables or disables debugging for all files in that group. If a file cannot be debugged (because it is a library or other non-source file), you cannot enable debugging for that file.


Generating Symbolics Information

To generate symbolics information, both the current build target and the source files within that target must be prepared for debugging. See Setting Up a File for Debugging to learn how to do this.

After you prepare the current build target and its source files, choose the Make command from the Project menu to compile and link your final code.

For more information on compiling and linking, see "Configuring Target Options" on page 315 as well as the Targeting manual for your particular platform target.


Using the Debugger

To debug a project, you must first enable debugging for that project. Choose Enable Debugger from the Project menu to enable debugging. After debugging is enabled, the Enable Debugger command changes to Disable Debugger.

When you enable debugging, the Run command in the Project menu changes to Debug. The Debug command compiles and links your project, generates a symbolics file, and activates the debugger. The debugger automatically loads the symbolics file so that you can debug your project. See "Preparing for Debugging" on page 390 for more information on this topic.


NOTE

(Mac OS) If the debugger is currently disabled, you can Option-click the Project menu to choose the Debug command. Although you need not enable the debugger beforehand, the project must have a symbolics file.

There are many build targets or kinds of code that the IDE cannot launch. For example, if you are writing an application plug-in, the plug-in cannot run on its own. In addition, the CodeWarrior IDE does not know which application must be running to invoke the plug-in. In such cases, you would need to specify the application that must launch in order to invoke the plug-in.

Usually, you open the symbolics file to debug the plug-in. Alternatively, you can follow these steps:

1. Open the Target Settings window for the project.

Choose Target Settings from the Project menu, where Target is the name of the current build target. For example, if your current build target is named MyAppRelease, you would choose MyAppRelease Settings from the Project menu.

2. Display the Runtime Settings panel.

Scroll through the list of panels on the left side of the Target Settings window. Click Runtime Settings to display that panel on the right side of the window.

3. Click the Choose button.

The IDE displays a dialog box to help you choose an application to launch when debugging shared libraries, dynamic link libraries (DLLs), and code resources. The IDE launches the application you specify when debugging the plug-in.


Guided Tour of the Debugger

This section explains the various windows, panes, and displays you can use when debugging. The topics discussed in this section include:


Stack Crawl Window

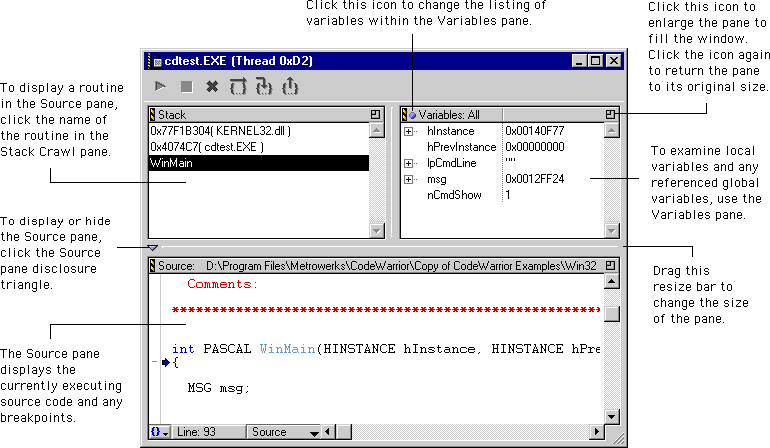
When the debugger opens a symbolics file, it opens a Stack Crawl window (formerly known as the Program window). This window is shown in Figure 11.3. The debugger allows more than one symbolics file to be open at a time: that is, you can debug more than one program at a time. For example, you can use this feature to debug an application and separate plug-ins for the application. A Stack Crawl is displayed for each active symbolics file and each thread.

The Stack Crawl window displays debugging information about the currently running routine. The Stack Crawl window has four points of interest:

You can resize panes by clicking and dragging the resize bar between them. Use the Tab key to switch keyboard focus between panes.


Mac OS

The active pane has a heavy border.

To select items in a focused Stack Crawl pane or Variables pane, type the first few characters of the item's name. You can also use the arrow keys to navigate through the items in an active pane.


Mac OS

You can also use Control-Tab as another way to navigate through items in an active Stack Crawl pane or Variables pane. To learn more about customizing key bindings, see "Customizing Key Bindings" on page 297.
There are additional controls along the very bottom of the Source pane, to the left of the horizontal scroll bar:

Figure 11.3 Parts of the Stack Crawl window


Debugger toolbar

The debugger toolbar (Figure 11.4) contains shortcut buttons for commonly used commands from the Project and Debug menus: Run, Stop, Kill, Step Over, Step Into, and Step Out.

Choose Window > Toolbar > Show Window Toolbar to display the toolbar. To hide the toolbar, choose Window > Toolbar >
Hide Window Toolbar.

For more information, see "Basic Debugging" on page 427.
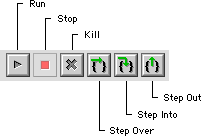
Figure 11.4 Debugger toolbar


Stack Crawl pane

The Stack Crawl window includes a Stack Crawl pane. This pane displays the current subroutine calling chain (Figure 11.5). Each subroutine is placed below the routine that called it. Select any routine in the Stack Crawl pane to display its code in the Source pane.

Figure 11.5 Stack Crawl pane


Variables pane

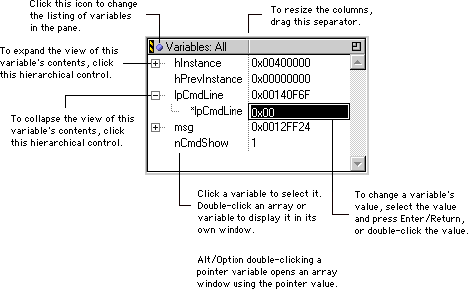
The Variables pane displays a list of local variables used in the program. The listing of these variables is controlled by the Variables Pane Listing icon (), shown in Figure 11.6. Clicking this icon toggles the list in the Variables pane between Variables:All and
Variables:Auto. These two list types are described in Table 11.2.

Table 11.2 Variables pane list types

Type
Variables Listed
Variables:All
All local variables in the code
Variables:Auto
Local variables of the routine in which the
Current-statement arrow is currently located


Mac OS

The Variables pane also displays any global variables referred to by the routine. Local and global variables are separated by a dashed line.

The Variables pane lists the variables in outline form. Click the hierarchical control next to an entry to expand or collapse the view of its contents.

Figure 11.6 Variables pane


For example, in Figure 11.6, clicking the hierarchical control next to the variable msg hides its members. Click the hierarchical control again to display the members. You can dereference multiple levels of pointers to get directly to the data by pressing the Ctrl/Option key while expanding an entry. This feature is useful for expanding a handle to a structured type and viewing the structure's members.


NOTE

Use the General Registers and FPU Registers windows to view the contents of the central-processor and floating-point registers. If the current build target does not have an FPU, the FPU Registers window is not available. For more information, see "Register Windows" on page 421.

Source pane

The Source pane in the Stack Crawl window displays source code. The debugger takes the source code directly from the current build target's source code files, including any comments and white space. The pane shows C/C++, Pascal, Java, and in-line assembly code exactly as it appears in your program's source code (Figure 11.7), using the font and color specified in the IDE's Editor Settings panel.

Click the Source pane disclosure triangle, shown in Figure 11.3 on page 397, to display or hide the Source pan. If you hide the Source pane, the debugger opens both an editor window and a Stack Crawl window the next time you start a debugging session. The editor window displays the same source code and breakpoints as the Source pane.
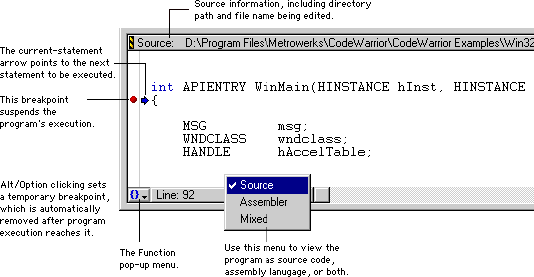
The Source pane lets you step through the program's source code line by line. Its progress is shown by the current-statement arrow, which always points to the next statement to be executed. The current-statement arrow is sometimes called the program counter.

Figure 11.7 Source pane in the Stack Crawl window


If there are two or more routine calls on a single line, each routine is executed separately as one step before the current-statement arrow moves to the next line. When this happens, the arrow is dimmed whenever the program counter is within, but not at the beginning of, a source-code line.

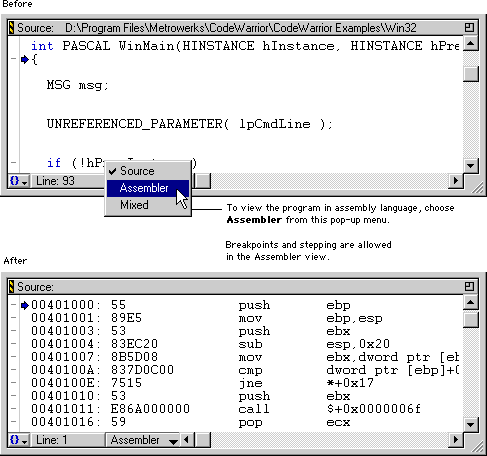
Figure 11.8 Source and assembly views


Viewing source code as assembly

To view your source code as assembly language, click the Source pop-up menu at the bottom of the Stack Crawl window. Choose Assembler to display the contents of the Source pane as assembly code (Figure 11.8). While viewing assembly code, the debugger still lets you step through the code and set breakpoints, one routine at a time.


NOTE

Use the General Registers and FPU Registers windows to view the contents of the central-processor and floating-point registers. If the current build target does not have an FPU, the FPU Registers window is not available. For more information, see "Register Windows" on page 421.

Viewing source with mixed assembly

To view your source code and assembly language together, click the Source pop-up menu at the bottom of the Stack Crawl window. Choose Mixed to display the source code of the current routine intermixed with assembly code (Figure 11.9). The source code that produced the assembly instructions appears before the assembly itself. When viewing code in mixed view, you can set breakpoints and step through code, but only for assembly language instructions. Notice you cannot set breakpoints on source code lines, as shown in Figure 11.9.
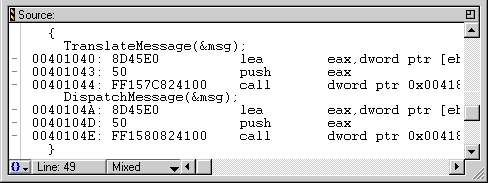
Figure 11.9 Viewing mixed code


If no symbolics information is available for the object code, the display reverts to Assembly. There is no syntax highlighting for this view, so the Source pane displays all text in plain format.


Function pop-up menu

The Function pop-up menu, at the bottom-left corner of the Source pane, contains a list of the routines defined in the source file selected in the Source pane (Figure 11.10). Selecting a routine in the Function pop-up menu displays that routine in the Source pane.

Alt/Option click the Function pop-up menu to display the menu items in alphabetical order.
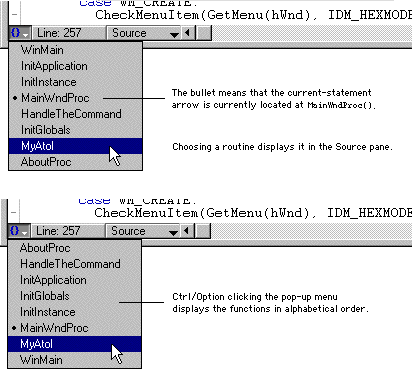
Figure 11.10 Function pop-up menu


Source Code Browser Window

When you double-click a symbolics file, the debugger opens a Source Code Browser window, as shown in Figure 11.11.
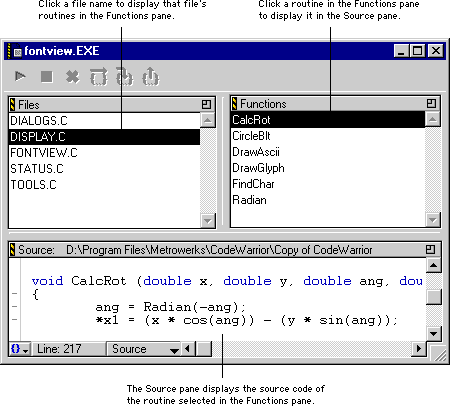
Figure 11.11 Source Code Browser window


The Source Code Browser window somewhat resembles the Stack Crawl window in both appearance and functionality, but displays different information. The Source Code Browser window lets you view any file in the current build target, whereas the Stack Crawl window can only display the file containing a routine selected from the Stack Crawl pane. You can also use the Source Code Browser window to view or edit the values of all of your program's global variables; the Stack Crawl window lets you change only those global variables referenced by active routines in the call chain. For more information about viewing global variables, see "Global Variables Window" on page 412.

For beginners

Do not confuse the Source Code Browser window with the Class Browser window. Although the two look similar, the Source Code Browser window opens only when you double-click a symbolics file.

The Source Code Browser window has three panes:

Like the Stack Crawl window, the Source Code Browser window has a debugger toolbar, a Function pop-up menu, a line number, and a Source pop-up menu. Also like the Stack Crawl window, the Source Code Browser window lets you resize panes by clicking and dragging the resize bar between them. You can switch between panes with the Tab key.


Mac OS

The active pane has a heavy border.

To select items in an active Files pane or Functions pane, type the first few characters of the item's name. You can also use the arrow keys to navigate through the items in an active pane.


Mac OS

You can also use Control-Tab as another way to navigate through items in an active Files pane or Functions pane.

The debugger allows more than one symbolics file to be open at a time: that is, you can debug more than one program at a time. You can use this feature, for example, to debug an application and separate plug-ins for the application. A Source Code Browser window is displayed for each opened symbolics file.

To learn more about the contents of the Stack Crawl window, refer to "Stack Crawl Window" on page 395.


Files pane

The Files pane in the Source Code Browser window (Figure 11.12) displays a list of all source files associated with the current build target you are debugging. When you select a file name in this pane, the Functions pane displays a list of the routines declared in the file.The Files pane is used in conjunction with the Functions and Source panes to set breakpoints in your program.

For more information, see "Global Variables Window" on page 412 and "Breakpoints" on page 442.
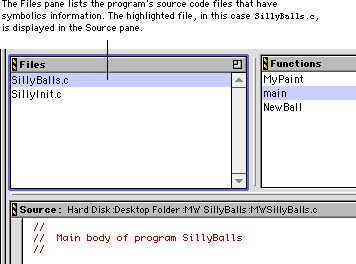
Figure 11.12 Files pane


Functions pane

When you select a source code file in the Source Code Browser window's File pane, the Functions pane (Figure 11.13) presents a list of all routines defined in that file. Clicking a routine name displays that routine in the Source pane at the bottom of the window.


NOTE

If your code is written in C++ or Object Pascal, the Sort functions by method name in browser option in the Display Settings preference panel (see "Display Settings" on page 279) alphabetizes function names which have the form className::methodName by method name instead of by class name.
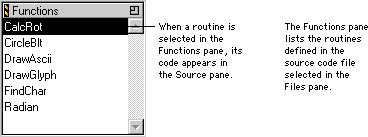
Figure 11.13 Functions pane


Source pane

The Source pane in the Source Code Browser window allows you to browse the contents of the source code file selected in the Files pane (Figure 11.14). You can use it to set breakpoints in any file listed in the Files pane. To learn how to set breakpoints, refer to "Breakpoints" on page 442.

Notice, however, that the Source pane does not show the currently executing statement. The current-statement arrow in the Stack Crawl window shows the currently executing statement. You can also use the Stack Crawl window to view local variables. For more information, see "Stack Crawl Window" on page 395.The Source pane displays code in the font and colors specified in the panels of the IDE Preferences window. For more information, see "Editor Settings" on page 269 and "Display Settings" on page 279.

If an item selected in the Files pane does not contain source code, the Source pane displays the message "Source text or disassembly not available."

The bottom of the Source Code Browser window has a Source pop-up menu like the one in the Stack Crawl window (see "Viewing source code as assembly" on page 402). Choose Assembler to display the contents of the source pane as assembly code, as shown earlier in Figure 11.8 on page 402. You can set breakpoints in assembly code, just as you can in source code. Choose Mixed to display source code intermixed with assembly language, as shown earlier in Figure 11.9 on page 403.
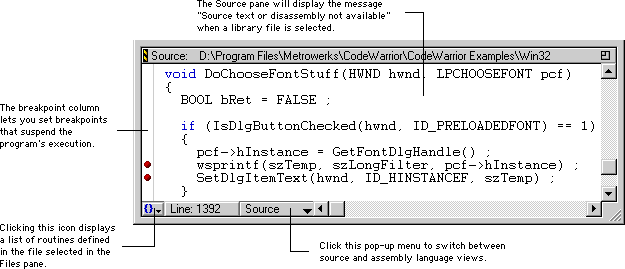
Figure 11.14 Source pane in the Source Code Browser window


Function pop-up menu

The Function pop-up menu, at the bottom-left corner of the Source pane, contains a list of the routines defined in the source file selected in the Files pane. Selecting a routine in the Function pop-up menu displays that routine in the Source pane, just as if you had clicked the same routine in the Functions pane.

Alt/Option click the Function pop-up menu to display the menu sorted alphabetically, as shown earlier in Figure 11.10 on page 404.


NOTE

The Function pop-up menu does nothing if there is no source code displayed in the Source pane.

Auto-Variables View

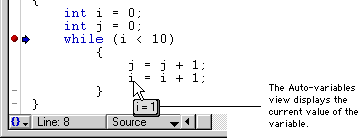
When you debug source code, the debugger displays useful information about your program's variables. This information is displayed automatically as you move the cursor over particular variables in source code views. For example, suppose you start a debugging session and examine your source code in the Source pane of the Stack Crawl window. When you position the cursor over the variable i, as shown in Figure 11.15, the debugger displays the current value of that variable.


NOTE

The Auto-variables view is only available when the debugger is active. If you do not see information about your program's variables, you need to activate the debugger. For more information, see "Preparing for Debugging" on page 390.

Figure 11.15 Auto-variables view


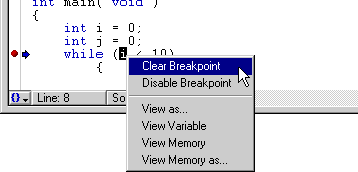
Debugger Contextual Menu

The debugger includes a contextual menu (Figure 11.16) that provides convenient access to various debugging commands. To display the contextual menu:


Windows

Right-click an item.


Mac OS

Control-click an item, or click and hold on an item.

Solaris

Control-click an item, or click and hold on an item.

Figure 11.16 Debugger contextual menu


The debugger uses the context of the item you select to determine the commands to display in the contextual menu. For example, if you choose a variable, the contextual menu includes commands for viewing the contents of that variable.


Expressions Window

The Expressions window (Figure 11.17) provides a single place to put frequently used local variables, global variables, structure members, and array elements without opening and manipulating several windows.

To open the Expressions window, choose Expressions Window from the Window menu.

Use the Copy to Expression command in the Data menu to add selected items to the Expressions window. Alternatively, you can select the same command from the debugger contextual menu (Figure 11.16 on page 411). You can also use the mouse to drag and drop items from other variable panes and windows into the Expressions window. To reorder items in the Expressions window, drag each item to its new position in the list.
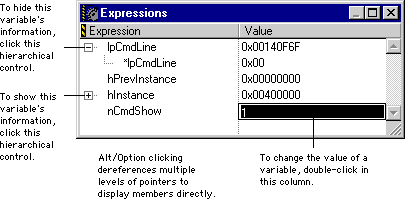
Figure 11.17 Expressions window


To remove an item from the Expressions window, select the item and press the Backspace/Delete key. You can also choose Clear from the Edit menu to remove the item.

Unlike local variables displayed in an ordinary Variables window, those in the Expressions window are not removed on exit from the routines in which they are undefined.

To learn about the Expressions window, refer to "Using the Expressions window" on page 461.


Global Variables Window

The Global Variables window (Figure 11.18) displays all global variables used by your program. You can also view static variables by selecting a file in the File pane. The static variables are displayed in the Variables pane.
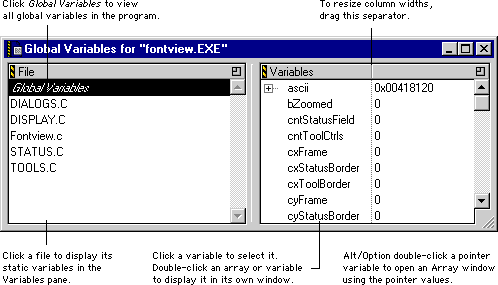
Figure 11.18 Global Variables window


Placing globals in a separate window

To display a global variable in its own window, double-click the variable's name in the Variables pane. A new Variable window opens and displays the variable's name and value. You can also open a Variable window by selecting the desired variable in the Variables pane and selecting the View Variable or View Array commands from the Data menu or the debugger contextual menu (Figure 11.16 on page 411). A global variable displayed in its own window can be viewed and edited the same way as in the Variables pane. You can also add global variables to the Expressions window.

Windows containing global variables remain open for the duration of the debugging session. To close all open Variable windows, make sure that one of the Variable windows is frontmost, then choose Close All Variable Windows from the File menu.

For more information, refer to "Expressions Window" on page 411, "Variable Window" on page 416, and "Array Window" on page 417.


Breakpoints Window

The Breakpoints window (Figure 11.19) lists the breakpoints in your current build target by source file and line number. To open the Breakpoints window, choose Breakpoints Window from the Window menu.
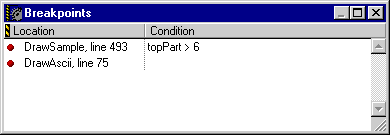
Figure 11.19 Breakpoints window


There is a breakpoint marker to the left of each listing. Clicking a breakpoint marker toggles a breakpoint's status. A solid dot indicates that the breakpoint is active, while a circle that indicates that the breakpoint is inactive. In either case, the IDE remembers the position of the breakpoints in the program. Alt/Option click one of the breakpoint markers in the Breakpoints window to simultaneously make all of the listed breakpoints active or inactive. Double-click a breakpoint listing to display the corresponding line of source code in an editor window.

Each breakpoint can have an attached condition. If the condition is true and the breakpoint is active, the breakpoint stops program execution. If the breakpoint is inactive or the condition is false, the breakpoint has no effect.

For more information, see "Breakpoints" on page 442, "Show Breakpoints" on page 620, "Hide Breakpoints" on page 620, and "Conditional breakpoints" on page 446.


Watchpoints Window

The Watchpoints window (Figure 11.20) lists the watchpoints in your current build target by memory address. To open the Watchpoints window, choose Watchpoints Window from the Window menu.

Figure 11.20 Watchpoints window


You can clear a watchpoint by selecting it and doing any of the following:

For more information, see "Watchpoints" on page 450.


Log Window

The Log window (Figure 11.21) displays messages as your program makes calls to system DLLs or starts new tasks.

To use the Log window, you need to configure your project to display log information. You must enable the Log System Messages preference in the Debugger Settings preference panel. See "Debugger Settings" on page 353 for more information.


NOTE

In Windows, log information includes messages about the loading and unloading of DLLs, as well as debug printf() messages. In the Mac OS, log information refers to messages about the loading of PowerPC code fragments, as well as DebugStr() messages.
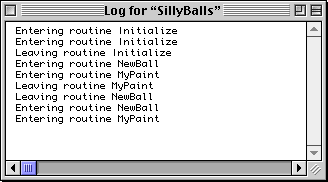
Figure 11.21 Log window


You can copy selected text from the Log window with the Copy command in the Edit menu. You can also use the Save As command in the File menu to save the Log window's contents to a text file for later analysis. If you choose to save to a text file, be sure to add an appropriate extension to the file's name, such as ".txt".


TIP

(Mac OS) To learn how to print out the messages in the Log window, see Targeting Mac OS.

Variable Window

The Variable window (Figure 11.22) displays a single variable and allows you to edit its contents. A Variable window containing a local variable will close on exit from the routine in which the variable is defined.

Figure 11.22 Variable window


Array Window

The Array window (Figure 11.23) displays a contiguous block of memory as an array of elements and allows you to edit the contents of those elements. To open the Array window, select an array variable in a Variables pane (either locals or globals) and then choose View Array from the Data menu.

You can also use the View Memory As command in the Data menu to open an array window. This command presents a dialog box which lets you select a data type, then opens an Array window interpreting memory as an array of that type. For more information, see "View Memory As" on page 623.
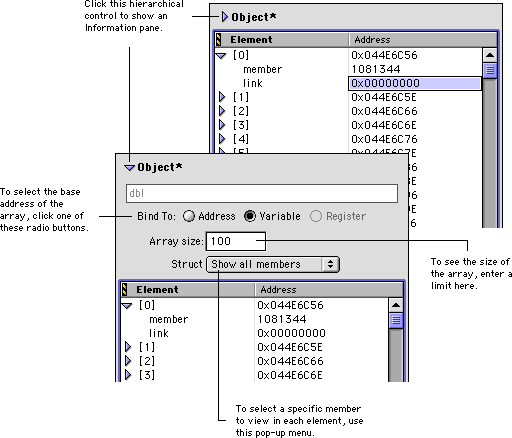
The Array window's title bar describes the base address to which the array is bound. An array's base address can be bound to an address, a variable, or a register. Dragging a register name or variable name from a Variables or Registers pane to an Array window sets the array address. An array bound to a local variable will close when the variable's routine returns to its caller.

The Information pane displays the data type of the array elements, along with the array's base address. Clicking the hierarchical control in the Information pane shows more information about the array. From the expanded Information pane, you can select the array's base address, its size, and which members to view if the array elements are of a structured type.

Figure 11.23 Anatomy of an Array window


The array's contents are listed sequentially, starting at element 0. If array elements are cast as structured types, a hierarchical control appears to the left of each array element, allowing you to expand or collapse the element.


Memory Window

The Memory window displays the contents of memory in hexadecimal and corresponding ASCII character values (Figure 11.24). To open a Memory window, select a variable, routine name, or expression representing the desired base address in the Program, Source Code Browser, or Expressions window and choose View Memory from the Data menu.


NOTE

The View Memory As command opens an Array window ("Array Window" on page 417) displaying memory as an array of data of a type you specify.

The source of the base address (which can be a variable, a routine, an expression, or a raw address like 0xCAF64C) is displayed at the top of the window. The Memory window is blank if the IDE cannot access the base address.

To change the base address, simply type a new expression in the Display text field. You can also or drag an expression to the field. If the expression does not produce an object in memory (an lvalue), then the value of the expression is used as the base address. For example, the Memory window expression


  PlayerRecord

will show memory beginning at the address of PlayerRecord.

If the expression's result is an lvalue, then the address of the object is used as the base address. For example, the expression


  *myArrayPtr

will show memory beginning at the address of the object pointed to by myArrayPtr.
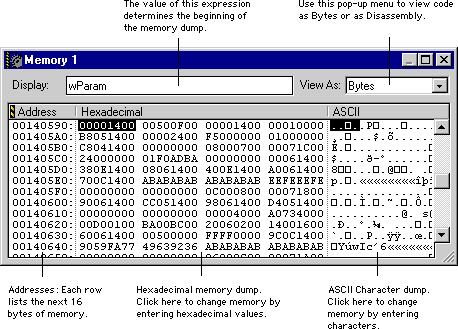
Figure 11.24 Memory window


You can use a Memory window to change the values of individual bytes in memory. Simply click in the displayed data to select a starting point and start typing. If you select a byte in the hexadecimal display, you are restricted to typing hexadecimal digits. If you select a byte in the ASCII display, you can type any alphanumeric character. Certain keys (such as Backspace/Delete, Tab, Enter/Return, and so forth) do not work. New data you type overwrites what is already in memory.


Mac OS

If the expression is a pointer-sized register, then the register's contents are used as the base address. For example, ®A0 (type Option-r for the first character) will show memory beginning at the address contained in the 68K register A0. Note that 64-bit floating-point registers cannot be used on a computer with a 32-bit central processing unit.


WARNING!

Arbitrarily changing the contents of memory can be very dangerous to your computer's stability and can result in a crash. Be sure you understand the consequences of any changes you make.

Register Windows

A Register window displays register contents and allows you to edit those contents. Different types of Register windows are available for different build targets. Two of the most common Register windows are the General Registers window and the FPU Registers window.


General Registers window

The General Registers window (Figure 11.25) displays CPU registers and allows you to edit register contents. To open a General Registers window, choose Window > Registers Windows > General Registers.


NOTE

The appearance of the General Registers window depends on the build target. The build target also determines the commands in the Registers Windows submenu. If a submenu is unavailable, simply choose Register Window to see the window shown in Figure 11.25.
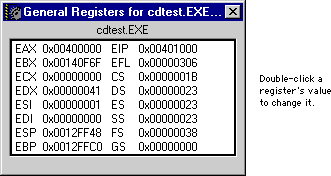
Figure 11.25 General Registers window (Windows)


To change a register's value, double-click the value or select the register and press Enter/Return. You can then type in a new value.


Mac OS

For PowerPC build targets, the General Registers window is shown in Figure 11.26. You can toggle the bit values of the XER and condition registers between 0 and 1. Select the bit you want to change and press Return or Enter. You can also double-click the bit to toggle its value.
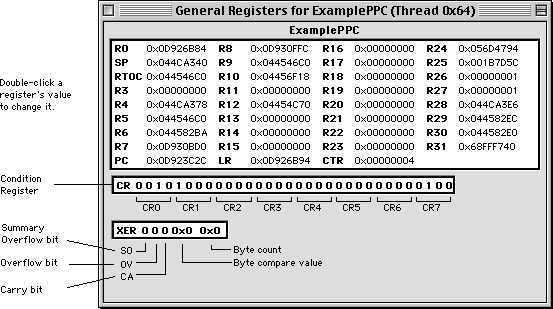
Figure 11.26 General Registers window (Mac OS PowerPC)


FPU Registers window

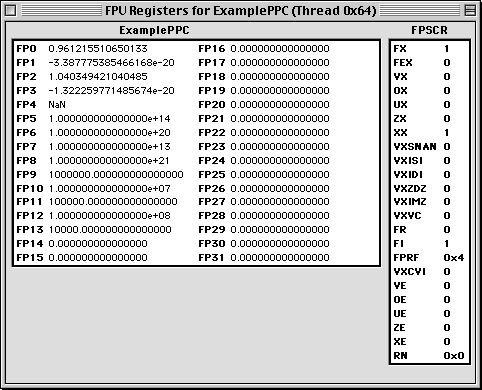
The FPU Registers window (Figure 11.29) displays FPU registers and allows you to edit register contents. To open an FPU Registers window, choose Window > Registers Windows > FPU Registers.


NOTE

The appearance of the FPU Registers window depends on the build target. The build target also determines the commands in the Registers Windows submenu. If a submenu is unavailable, simply choose FPU Registers Window to see the window shown in Figure 11.29.
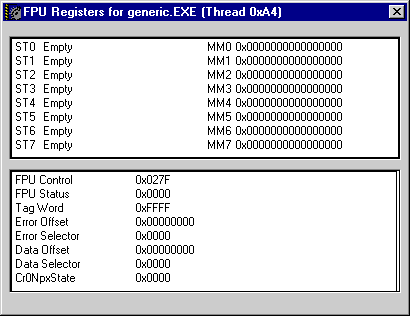
Figure 11.27 FPU Registers window (Windows)


To change a register's value, double-click the register value or select the register and press Enter/Return. You can then type in a new value.


WARNING!

Changing the value of a register is a very dangerous thing to do. It could corrupt your data, memory, or cause a crash.

Figure 11.28 FPU Registers window (Mac OS)


Processes Window

The Processes window (Figure 11.29) lists currently running processes, including some hidden processes. The Processes window also lists tasks for a selected process. To open the Processes window, choose Processes Window from the Window menu.

The Processes window has two panes and a toolbar:
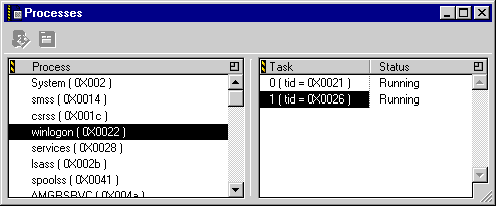
Figure 11.29 Processes window


Processes window toolbar

The Processes window toolbar (Figure 11.30) has controls to attach debugging sessions to selected processes and to open the Stack Crawl window.
The Process Attach button assigns a debugging session to the selected process. This button is useful for debugging processes when the debugger cannot target those processes. For example, when debugging a program that uses dynamic link libraries or shared libraries, you can use the Process Attach button to place those libraries under the debugger's control. The Process pane displays a check mark next to attached processes.

Figure 11.30 Processes Window Toolbar


The Stack Crawl window button displays the Stack Crawl window for the selected process or task. If a process is selected, the Stack Crawl window for that process is brought to the front. If a task is selected, the Stack Crawl window for that task is brought to the front. You can have multiple Stack Crawl windows open at a time.


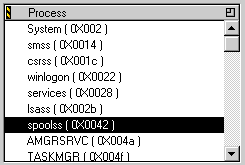
Process pane

The Process pane lists all active processes. A process under the debugger's control has a checkmark next to its entry in the window. To set debugger control for a process, click the checkmark column. Double-clicking a process name activates that process.

Figure 11.31 Process pane


Task pane

The Task pane lists all the active tasks for a given process. Only tasks from programs under the debugger's control are shown. Double-clicking a task name activates a Stack Crawl window with the code for that task. You can also choose a task and then click the Stack Crawl window button (Figure 11.30).
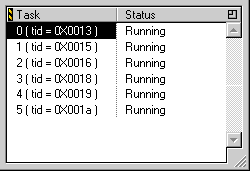
There are two columns in the Task pane. The first column displays the task ID. The second column shows the task's status. The task can be running, stopped, or crashed.

Figure 11.32 Task pane


Basic Debugging

This section discusses how to use the debugger to locate and solve problems in your source code by controlling program execution and viewing your data and variables. The principal topics discussed are:

This section assumes you are familiar with the debugger's user interface, described in "Guided Tour of the Debugger" on page 395. To learn how to prepare a build target for debugging, see "Preparing for Debugging" on page 390. For information on how to set the debugger's preferences, see "Debugger Preferences" on page 278.


Starting Up

To use the debugger, first open a project. Next, choose Enable Debugger from the Project menu. Then, choose the Debug command from the Project menu to debug the project.

When using the debugger on your code, you should pay careful attention to what happens. The following two situations can occur:

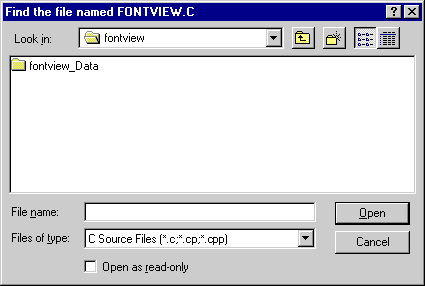
Figure 11.33 Find the file (Windows)


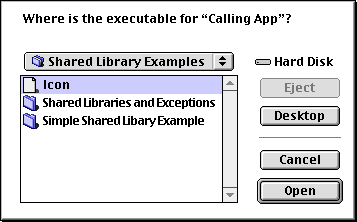
Figure 11.34 Where is the executable? (Mac OS)


The debugger might ask you for the location of a particular file, as shown in Figure 11.33 (Windows) or Figure 11.34 (Mac OS).

You might see this dialog either upon startup (the debugger is looking for the file with the main entry point) or by clicking on a specific file in the Source Code Browser Window.

The debugger might ask you to locate files in these situations:

The last case is most common if a library you are using in your build target is compiled with symbolics file generation enabled. This is especially true with some of the libraries distributed with CodeWarrior.

Once you find the file, the debugger will remember the new location, even between debugging sessions.

For more information, see "Generating Symbolics Information" on page 393.


Running, Stepping, and Stopping Code

This section discusses how to how to run your code, step through it line by line, and stop or kill the build target when you want to stop debugging.

Moving through code line by line is often called "stepping" through your code. It is a linear approach to navigation, where you start at the beginning and move steadily through the code. This is important for understanding how to navigate your code. The debugger lets you navigate to any location directly, stop your code at specific locations when certain conditions are met, and view as well as modify your data.

To step through your code, you can use the debugger toolbar buttons, the keyboard, or choose the appropriate menu command. Table 11.3 lists the debugger toolbar buttons along with their Debug menu commands and their default keyboard equivalents.

Table 11.3 Buttons and default keyboard equivalents

Button
Menu
Command

Windows Keyboard Equivalen
Mac OS Keyboard Equivalent
Solaris Keyboard Equivalent
Run
F5
Command-R
Command-R
Stop
Control-P
Control-P
Kill
Shift-F5
Control-K
Control-K
Step Over
F10
Control-S
Control-S
Step Into
F11
Control-T
Control-T
Step Out
Shift-F11
Control-U
Control-U

This section discusses:


Current-statement arrow

The current-statement arrow in the Stack Crawl window (Figure 11.35) indicates the next statement to be executed. It represents the processor's program-counter register. When you begin a debugging session, the current-statement arrow points to the first line of executable code in your program.

Figure 11.35 The current-statement arrow


Running your code

If the program is running but its execution has stopped, use the Run command (Figure 11.36) to restart your program. The program resumes execution at the current-statement arrow.

Figure 11.36 The Run command


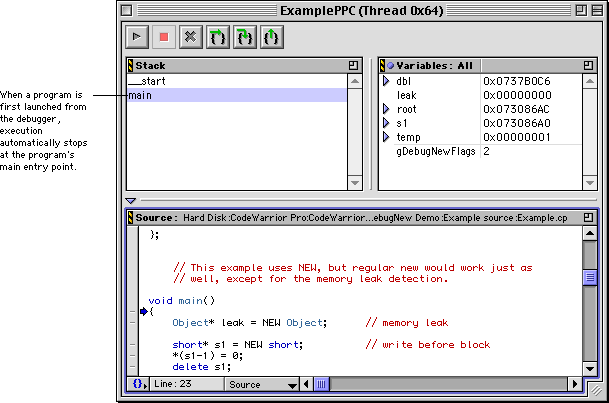
After a breakpoint or a Stop command, the debugger regains control and displays the Stack Crawl window with the current-statement arrow and the current values of variables. The debugger places an implicit breakpoint at the program's main entry point and stops there (Figure 11.37). Issuing another Run command resumes program execution from the point of the interruption. After a Kill command, Run restarts the program from its beginning.


TIP

You can inhibit the automatic launch of the program by holding down the Alt/Option key while opening the symbolics file. You can also change the Automatically launch applications when SYM file opened preference (see "Global Settings" on page 283). One use for this feature is to debug C++ static constructors, which are executed before entering the program's main routine.

Figure 11.37 Starting the program's execution


Stepping through a single line

To execute one statement, use the Step Over command (Figure 11.38). If the statement is a routine call, the entire called routine executes and the current-statement arrow proceeds to the next line of code. In other words, the Step Over command executes a routine call without visiting the code in the called routine. This behavior holds true if the routine does not have breakpoints and does not call other routines. When you step over code and reach the end of a routine, the current-statement arrow returns to the routine's caller.

Figure 11.38 The Step Over command


Stepping into routines

Sometimes you want to follow execution into a called routine. To execute one statement at a time and follow execution into a routine call, use the Step Into command (Figure 11.39).

Figure 11.39 The Step Into command


Step Into moves the current-statement arrow down one statement, unless the current statement contains a routine call. When Step Into reaches a routine call, the debugger follows execution into the routine being called.


Stepping out of routines

To execute statements until the current routine returns to its caller, use the Step Out command (Figure 11.40). Step Out executes the rest of the current routine normally and stops the program when the routine returns to its caller. You go one level back up the calling chain. See "Call-chain navigation" on page 438 for more information.

Figure 11.40 The Step Out command


Skipping statements

Sometimes you may want to skip statements altogether and not execute them at all. To move the current-statement arrow to a different part of the currently executing source code, simply drag it to a new position, as shown in Figure 11.41. Note that dragging the current-statement arrow up or down does not execute the statements between the arrow's original position and its new position.


WARNING!

Dragging the current-statement arrow is equivalent to deliberately changing the program counter in the Register window. This is very dangerous, because you might corrupt the stack by skipping routine calls and returns. The debugger is not able to prevent you from corrupting your run-time environment.

Figure 11.41 Dragging the current-statement arrow


To move the current-statement arrow without potentially corrupting the run-time environment, Alt/Option click a statement in the Breakpoint column (Figure 11.42). Alt/Option clicking the statement sets a temporary breakpoint: Execution proceeds normally until the current-statement arrow reaches the temporary breakpoint, then stops. After execution stops, the temporary breakpoint is automatically removed. For more information, see "Breakpoints" on page 442.

Figure 11.42 Setting a temporary breakpoint


Stopping execution

While your program is running, you can use the Stop command (Figure 11.43) to suspend execution and explore your code with the debugger. You can then step through your code from that point, or use the Run command to resume execution.

Figure 11.43 The Stop command


Stopping in this manner is not very precise. Code executes very quickly, and there is no telling exactly where your program is suspended when you issue the Stop command. Instead of stopping code, you can use breakpoints, which allow you to suspend a program's execution at a specific point. To learn more, see "Breakpoints" on page 442.


NOTE

The Stop command is not available for some build targets because it is dependent on operating system services. For details on any particular build target, see the corresponding Targeting manuals as described in "Targeting Documentation" on page 27.

TIP

(Mac OS) If your program hangs in an infinite loop, you can regain control by typing the combination Command-Control-/ from your keyboard. This will interrupt the program and return control to the debugger so you can examine your code.

Killing execution

Sometimes you want to terminate your program completely and end the debugging session. The Kill command (Figure 11.44) ends the program and returns control to the debugger. The Stack Crawl window tells you when the program is running, and to choose Stop from the Debug menu to stop it.

Figure 11.44 The Kill command


Killing the program is not the same as stopping. The Stop command only suspends execution temporarily: you can resume from the point at which you stopped. The Kill command permanently terminates the program.


Navigating Code

This section discusses the various ways you can move around in your code. This skill is vital when you want to set breakpoints at particular locations. Methods of moving around in code include:


Linear navigation

You can "walk" through your code by using the Step Over, Step Into, and Step Out commands as needed until you reach the place you want. This is useful for short stretches of code, but not very helpful when you want to get to a specific location many steps away.

"Stepping through a single line" on page 433, "Stepping into routines" on page 434, and "Stepping out of routines" on page 434 describe various ways to linearly navigate through your code.


Call-chain navigation

The chain of routine calls is displayed in the Stack Crawl pane of the Stack Crawl window (Figure 11.45). Each routine in the chain is displayed below its caller, so the currently executing routine is at the bottom of the chain and the first routine to execute in the program is at the top.

You can use the Stack Crawl pane to navigate to the routines that called the halted routine. To find the point where a routine in the Stack Crawl pane is called, click the name of the routine's caller. The source code for the caller is displayed in the Source pane, right at the point of the call (Figure 11.46).

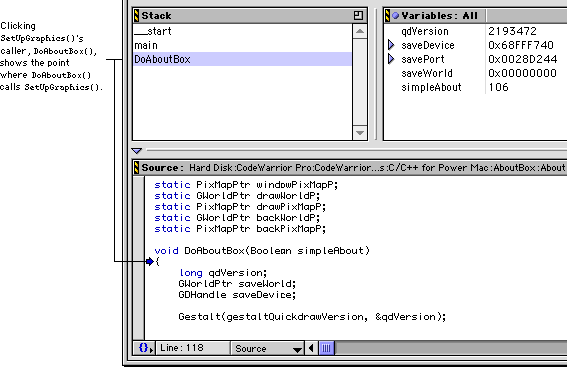
Figure 11.45 The stack crawl pane


Figure 11.46 Finding a routine's point of call


Source Code Browser window navigation

You can use the Source Code Browser window to jump to any location in your source code. The debugger displays this window only when you open a symbolics file. To view a specific routine, follow these steps:

1. Make the Source Code Browser window active (Figure 11.47).
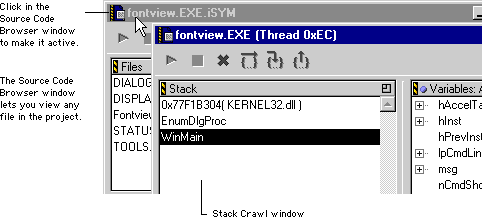
Figure 11.47 Activating the Source Code Browser window


2. In the Source Code Browser window's Files pane, select the file where the routine is defined (Figure 11.48).
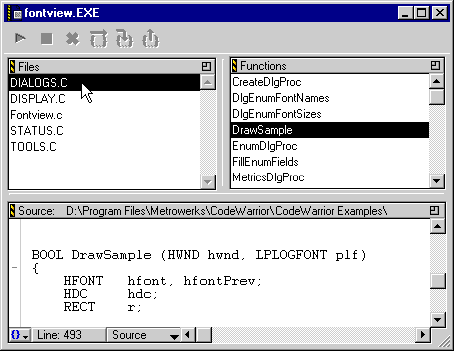
Simply click the desired file, or use the arrow keys to scroll through the list. The source code for that file appears in the Source pane. You can also type the name of the file.

Figure 11.48 Selecting a file to view its contents


3. Locate the desired code in the source file.

Scroll through the Source pane to find the code you want. A more useful technique is to use the Source Code Browser window's Functions pane or Function pop-up menu to select the desired routine (Figure 11.49). The routine is displayed in the Source pane, allowing you to set and clear breakpoints. For more information, see "Breakpoints" on page 442.
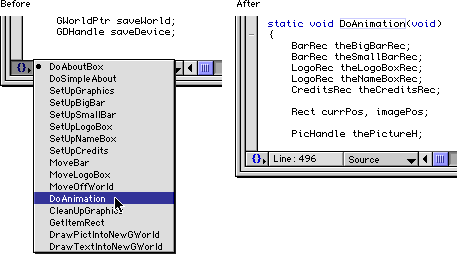
Figure 11.49 Choosing a routine to view


Changing font and color

The debugger displays source code in the font and color specified in the Editor preference panels of the IDE Preferences window.

For more information, see "Editor Preferences" on page 268.


Breakpoints

A breakpoint suspends execution of a program and returns control to the debugger. When the debugger reaches a statement with a breakpoint, it stops the program before the statement is about to execute. The debugger then displays the routine containing the breakpoint in the Stack Crawl window. The current-statement arrow moves to the line containing the breakpoint and points to the next statement that is ready to execute.

This section discusses:


Setting and clearing breakpoints

From the Source pane of the editor window, Stack Crawl window, or Source Code Browser window, you can set a breakpoint on any line with a dash marker-the short line to the left of a statement in the Breakpoint column (see Figure 11.50). The dash becomes a dot (on color monitors, the default dot color is red). This dot indicates that a breakpoint has been set at this statement. Execution will stop just before this statement is executed.
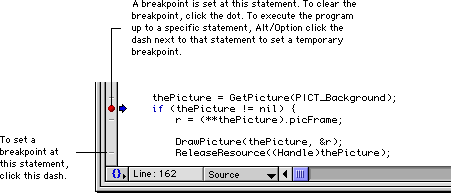
Figure 11.50 Setting breakpoints


Another way to set a breakpoint is to click a particular line of source code in the Stack Crawl window and choose Set Breakpoint from the Debug menu.

To clear a single breakpoint, click the breakpoint dot in the Source pane. The dot turns back into a dash, indicating that you have removed that breakpoint.

You can manipulate breakpoints with the following commands in the Debug menu:

In addition, you can use the debugger's contextual menu in source code views and the Breakpoints window to choose the same menu commands. For more information, see "Debugger Contextual Menu" on page 410.


TIP

Put one statement on each line of code. This makes your code not only easier to read, but also easier to debug. The debugger allows only one breakpoint per line of source code, no matter how many statements a line contains.

Temporary breakpoints

Regular breakpoints stop a program's execution each time you debug your project. However, you can also set temporary breakpoints that stop a program's execution only once. When the temporary breakpoint is reached, the debugger stops the program and then removes the temporary breakpoint.

To set a temporary breakpoint, Alt/Option click the breakpoint dash to the left of the desired statement.


NOTE

If there is already a regular breakpoint on a particular line, Alt/Option clicking removes the regular breakpoint, but the temporary breakpoint still works.

If the debugger encounters another breakpoint before reaching the temporary breakpoint, the program stops at the first breakpoint. The temporary breakpoint remains in place. After the temporary breakpoint is reached, it is triggered and then removed.


Viewing breakpoints

To see a list of all active breakpoints in your program, choose the Breakpoints Window command from the Window menu. The debugger displays a window that lists the source file and line number for each breakpoint (Figure 11.51). Clicking a breakpoint marker in the Breakpoints window toggles the breakpoint's status between active and inactive. A dot indicates that the breakpoint is active. The debugger stops the program's execution upon reaching an active breakpoint. A circle indicates that the breakpoint is inactive. The debugger continues to execute the program without stopping at an inactive breakpoint. The debugger remembers the position of inactive breakpoints in the program.


NOTE

Double-clicking a breakpoint location in the Breakpoints window will take you to that line of code in the Stack Crawl window or Source Code Browser window.

For more information, see "Breakpoints Window" on page 413.
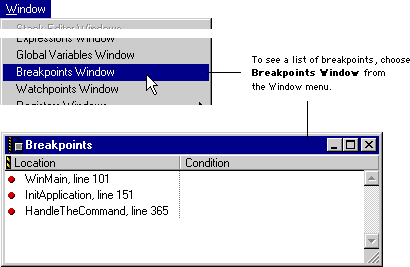
Figure 11.51 Displaying the Breakpoints window


Conditional breakpoints

You can set conditional breakpoints that stop your program's execution at a given point only when a specified condition is met. A conditional breakpoint is an ordinary breakpoint with a conditional expression attached. If the expression evaluates to a true (nonzero) value when control reaches the breakpoint, the program's execution stops; if the value of the expression is false (zero), the breakpoint has no effect and program execution continues.

Conditional breakpoints are created in the Breakpoints window. To specify a conditional breakpoint:

1. Set a breakpoint at the desired statement.

2. Display the Breakpoints window by choosing Breakpoints Window from the Window menu.

3. In the Breakpoints window, double-click the breakpoint's Condition field and enter an expression, or drag an expression from a source-code view or from the Expressions window.

In Figure 11.52, the debugger stops execution at line 162 in the NewBall() routine if and only if the variable newTop is greater than six.
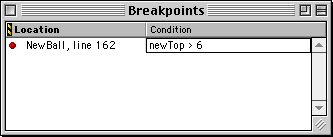
Figure 11.52 Creating a conditional breakpoint


NOTE

Conditional breakpoints are especially useful when you want to stop execution inside a loop, but only after going through several iterations of that loop. You can set a conditional breakpoint inside the loop that stops the program's execution when the loop index reaches the desired value.

Setting breakpoints for templated or redefined functions

You can set breakpoints for templated functions as well as functions that have been redefined.

For example, suppose you have a file named file.h that defines a function void FOO(args), where FOO is a macro. If you create the lines of code shown in Listing 11.1, a pop-up menu appears in the Breakpoints column during the debugging session. This pop-up menu lets you choose whether to set a breakpoint for function1 or function2.


Listing 11.1 Example for templated and redefined functions


#define FOO function1
#include file.h
#define FOO function2
#include file.h


Impact of optimizing code on breakpoints

In order to accurately set breakpoints, the debugger relies on a direct correspondence between source code and object code. Optimizing your code can disrupt this relationship and cause problems when setting breakpoints.

If there is no breakpoint dash to the left of a line of source code, you cannot set a breakpoint at that line. The potential causes are:

The code optimization cause is the most common. For example, the PowerPC compiler lets you set a breakpoint when the start of a source statement corresponds to the start of a "statement block" that has at least one instruction in it. (You do not need to understand the term "statement block" in this example.)

Normally, when debugging information is enabled for a source file, the compiler tries to start a new statement block at each source statement that actually generates some code. For example, consider the source code in Listing 11.2:


Listing 11.2 Sample code with breakpoints


	-	int i = 1;
	-	if (i)
{ //This is the third line.
int k;
- int j = 1;
- i = j;
}

Since the third line does not generate instructions, it does not have a unique object code address. Therefore, the debugger does not permit a breakpoint on that line.

After you start optimizing the code, the situation changes. For example, when you enable Instruction Scheduling in the project's Global Optimizations preference panel, the compiler no longer starts a new basic block for each source statement. The scheduler gains the maximum flexibility for reordering instructions within the block. The different instructions that correspond to a source statement are no longer consecutive. Instead, they are intermingled with the instructions from other source statements. Because of these optimizations, the debugger no longer displays breakpoint dashes as shown in Listing 11.2.

When you enable additional optimizations, the source statements may not even appear in the generated code. For example, consider the following code:


Listing 11.3 Sample code with a loop


		i = 0;
		j = 0;
while (i < 10)
{
j = j + 1;
i = i + 1;
}

With minimal optimization, the compiler translates the code from Listing 11.3 into the following equivalent code:


	j = j + 1;        // duplicate 10 times
	j = j + 1;
.
.
.
j = j + 1;

With even more optimization, the compiler totally eliminates instructions corresponding to the while loop and uses the following equivalent code:


j = 10;


While debugging your code, you should disable optimizations or use optimizations that are "debug safe." Different optimizations are available for different build targets. See the appropriate Targeting manual for additional details, as described in "Targeting Documentation" on page 27.

You can view the current optimizations for your project in the Global Optimizations preference panel of the Target Settings window. For more information, refer to "Configuring Target Options" on page 315.

After setting a breakpoint, you can continue debugging the program. Refer to "Running, Stepping, and Stopping Code" on page 430 for additional details.


Watchpoints

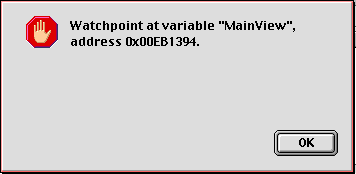
A watchpoint is a location or region of memory that you want the debugger to observe for you. Whenever a new value is written to that area of memory, the debugger suspends execution of the program and notifies you with an alert message on your screen (Figure 11.53). After dismissing the alert, you can examine the call chain, inspect or change variables, step through your code, or use any of the debugger's other facilities. (In particular, from the debugger level, you can change the contents of the location that triggered the watchpoint without triggering it again.) Use the Run command (or the Run button on the debugger toolbar) to continue execution from the watchpoint.

The following sections discuss watchpoints in more detail:


NOTE

(Mac OS) Watchpoints require System 7.5 or later, and will not work on 68K computers unless you enable virtual memory. Watchpoints are also known to be incompatible with the Speed Emulator portion of Speed Doubler, and possibly with RAM Doubler as well.

If you have a small program with a small set of global variables for 68K, the global data area is placed against the end of the stack. Since the debugger cannot detect watchpoints for variables on the stack, the global variables cannot be watched. One way to avoid this problem is to declare a global array of type char, about four kilobytes in size, to move the global variables away from the stack.

Figure 11.53 Watchpoint alert


Setting and clearing watchpoints

You can set a watchpoint in any of the following ways:

Variables or memory locations on which a watchpoint has been set are underlined in red in the Variable and Memory windows. To learn how to change this default color, refer to the section "Syntax Coloring" on page 274.


WARNING!

There are some significant restrictions on where in memory you can place a watchpoint. You can use watchpoints only on global variables or on objects allocated from your application heap. You cannot set a watchpoint on a stack-based local variable or on a variable being held in a register


Mac OS

You cannot set a watchpoint anywhere in low memory or the system heap. If you attempt to set a watchpoint in this area of memory, an alert box displays with the following text: "Could not set a watchpoint because the page containing that memory location overlaps low memory or the system heap."


NOTE

(Mac OS) When debugging small 68K projects, you might see an alert box with the following text when trying to set watchpoints on a global variable: "Could not set a watchpoint at that location because it is on the stack." This is a limitation of the classic 68K runtime architecture, not the debugger.

You can clear a watchpoint in any of the following ways:

¯ Choose Clear Watchpoint from the Debug menu

¯ Choose Clear from the Edit menu

¯ Press the Backspace/Delete key

  • Invoke the debugger contextual menu for a selected watchpoint and choose the Clear Watchpoint command.
  • All watchpoints are automatically cleared when the program's execution terminates or is killed by the debugger.


    Viewing watchpoints

    To see a list of all watchpoints currently set in your program, choose the Watchpoints Window command from the Window menu. The debugger displays the Watchpoints window (Figure 11.54).

    For more information, see "Watchpoints Window" on page 414.
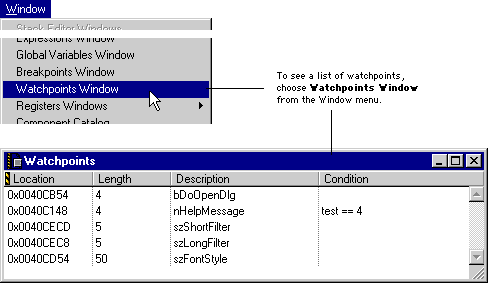
    Figure 11.54 Displaying the Watchpoints window


    Viewing and Changing Data

    A critical feature of a debugger is the ability to see the current values of variables, and to change those values when necessary. This ability allows you to understand the details of your program's execution, and to experiment with new possibilities.

    This section discusses the following topics:

    For additional information on viewing and changing data for a particular target, see the corresponding Targeting manual.


    Viewing local variables

    Local variables are displayed in the Variables pane of the Stack Crawl window (Figure 11.55). If the variable is a handle, pointer, or structure, you can click the hierarchical control to the left of the name to expand the view. This allows you to see the members of the structure, or the data referenced by the pointer or handle.

    To learn some useful tips for using hierarchical controls, see "Expanding and Collapsing Groups" on page 74. For more information about the Variables pane of the Stack Crawl window, refer to "Variables pane" on page 398.

    Figure 11.55 Viewing local variables


    Viewing global variables

    To view global variables, choose Global Variables Window from the Window menu. Next, click the Global Variables item in the File pane (Figure 11.56). Then, the Variables pane displays the global variables in your program.

    For more information, refer to "Global Variables Window" on page 412.
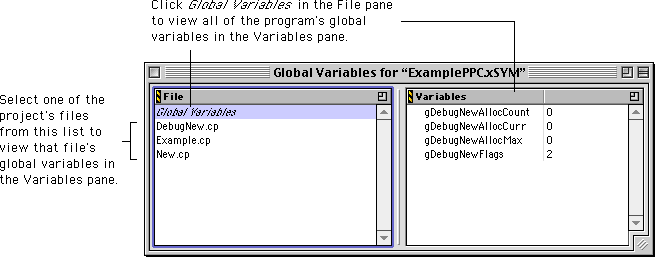
    Figure 11.56 Viewing global variables


    Placing data in a new window

    Sometimes the Variables pane and Global Variables window are not the most convenient places to view data. You can place any variable or group of variables in a separate window.

    To place a variable or memory location in its own window, double-click its name (Figure 11.57) or select the name and choose the View Variable command from the Data menu or the debugger contextual menu (Figure 11.16 on page 411). If the variable is an array, use the View Array command instead. To view the memory the variable occupies as a memory dump, use either the View Memory or View Memory As command.
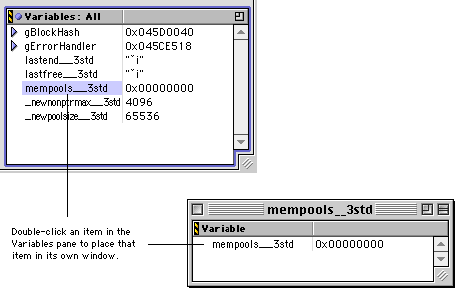
    Figure 11.57 Placing a variable in its own window


    For more information, see "Variable Window" on page 416, "Array Window" on page 417, and "Memory Window" on page 418.


    Viewing data types

    If you wish, the debugger can display the data types of variables on a window-by-window basis. Select the window or pane in which you want data types displayed and choose Show Types from the Data menu or the debugger contextual menu (Figure 11.16 on page 411). Then, the names of the variables and memory locations in that window or pane are followed by the relevant data type (Figure 11.58).


    TIP

    To show data types automatically, enable the following preference in the Display Settings preference panel of the IDE Preferences window:

    In variable panes, show variable types by default

    See "Display Settings" on page 279 for more information.
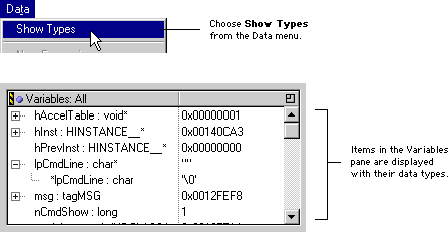
    Figure 11.58 Viewing data types


    Viewing data in a different format

    You display a variable's value in several formats:

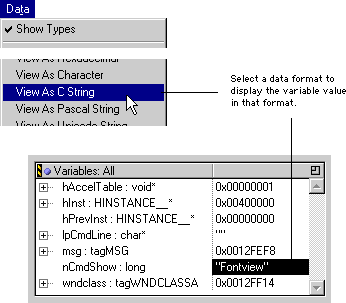
    To view data in a particular format, select either the name or the value of the variable in any window in which it is displayed, then choose the format you want from the Data menu (Figure 11.59) or the debugger contextual menu (Figure 11.16 on page 411).

    Figure 11.59 Selecting a data format


    Not all formats are avialable for all data types. For example, if a variable is an integral value (such as type short or long), you can view it in signed decimal, unsigned decimal, hexadecimal, character, or string format. However, you cannot view the same variable in floating-point, Fixed, or Fract format.


    Viewing data as different types

    The View As command in the Data menu lets you change the data type in which a variable, register, or memory value is displayed:

    1. Select the item in a window or pane.

    2. Choose View As from the Data menu.

    Alternatively, you can use the debugger contextual menu (Figure 11.16 on page 411) to select the same command. After you select View As, the debugger displays the View As dialog box, shown in Figure 11.60.

    3. Select the data type by which to view the item.

    The data type you select is displayed in the New Type text field near the bottom of the dialog box. If you want to treat the item as a pointer, append an asterisk (*) to the type name.

    4. Click OK.

    The display of the item's value changes to the specified type.
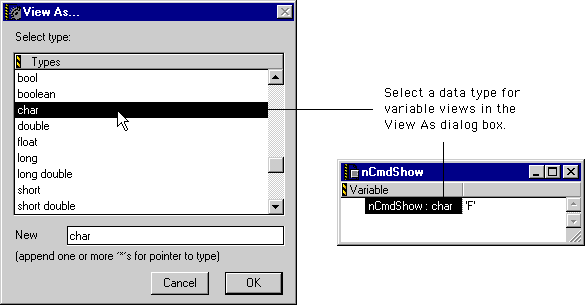
    Figure 11.60 Selecting a data type


    Changing the value of a variable

    You can change the value of a variable in any variable view. Variables are displayed in several debugging windows: the Variables pane of the Stack Crawl window or Source Code Browser window, a Variable window, an Array window, or the Expressions window. To change the value, double-click the variable (or select it and press Enter/Return) and type the new value (Figure 11.61).
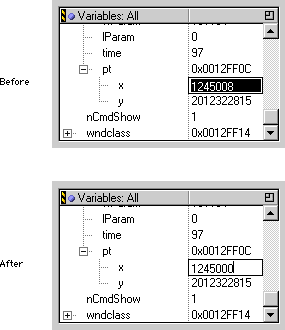
    Figure 11.61 Changing a variable value


    You can enter variable values in any of the following formats:

    To enter a string or character constant, you must include C-style quotation marks (single quotes '' for a character constant, double quotes "" for a string). For Pascal strings, include the escape sequence \p as the first character in the string.


    WARNING!

    Changing variable values can be dangerous. The debugger allows you to set a variable to any value of the appropriate data type. For example, you could set a pointer to nil and crash the machine.

    Using the Expressions window

    The Expressions window provides a single place to put frequently used local variables, global variables, structure members, array elements, and complex expressions without opening and manipulating several windows. To open this window, choose Expressions Window from the Window menu. You can add an item to the Expressions window by dragging and dropping that item from another window, or by selecting the item and choosing Copy to Expression from the Data menu or the debugger contextual menu (Figure 11.16 on page 411).

    The contents of the Expressions window are updated whenever execution stops in the debugger. Any variable that is out of scope is left blank. You can take advantage of the Expressions window to perform a number of useful tasks:

    For more information, see "Expressions Window" on page 411.


    Viewing raw memory

    To examine and change the raw contents of memory:

    1. Select an item or expression representing the base address of the memory you want to examine.

    2. Choose View Memory from the Data menu.

    A new Memory window opens, displaying the contents of memory in hexadecimal and ASCII format. You can change memory directly from the Memory window by entering hexadecimal values or characters. You can also change the beginning address of the memory being displayed by changing the expression in the Display text field at the top of the window.


    Viewing memory at an address

    The View Memory and View Memory As commands in the Data menu allow you to follow any pointer-including an address stored in a register-and view the memory to which it currently points. To display the memory referenced by a pointer:

    1. Select the value of the variable or register in a window in which it is displayed.

    2. Choose View Memory or View Memory As from the Data menu.

    If you choose View Memory, a Memory window opens displaying a raw memory dump starting at the address referenced by the pointer. If you choose View Memory As, a dialog box opens and asks you to select a data type (Figure 11.62); continue with step 3.

    3. If you chose View Memory As, select a data type in the View As dialog box.
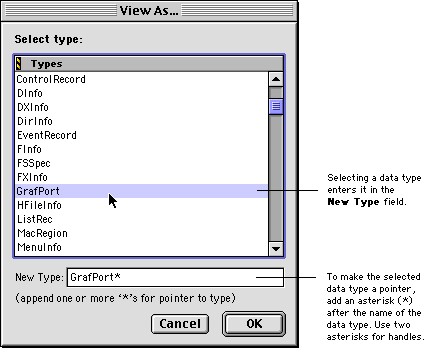
    The data type you select is displayed in the New Type text field near the bottom of the dialog box. To view the memory pointed to by a register, append an asterisk (*) to the type name.

    Figure 11.62 Choosing a data type to view memory


    4. Click OK.

    A new window opens (Figure 11.63) and displays the contents of memory, starting at the address referenced by the pointer.
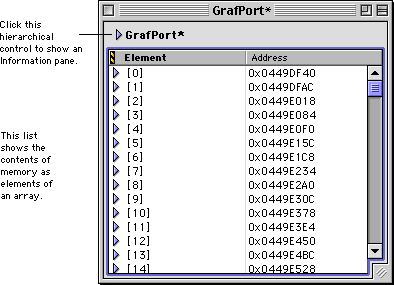
    Figure 11.63 Viewing memory as a specified data type


    NOTE

    You can use this technique to view the contents of the stack. If your target processor stores the stack pointer in a particular register, select the value of that register. Then follow the steps above.

    For more information, refer to "Memory Window" on page 418.


    Viewing Processor Registers

    To view the contents of the processor's general registers, choose Window > Registers Windows > General Registers from the Window menu (Figure 11.64).
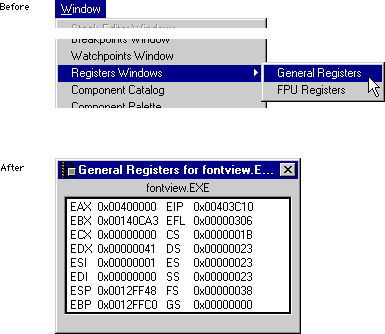
    Figure 11.64 Viewing general processor registers


    For more information, see "Register Windows" on page 421.


    Editing Source Code

    You cannot edit source code directly in the debugger. However, you can use the debugger to open the source-code file so that you can modify your code. In the Files pane of the Source Code Browser window, you can double-click a file name to open the file in an editor window.


    Windows

    You can specify that a third-party editor open the file. See "IDE Extras" on page 254 for more information.


    Expressions

    An expression represents a computation that produces a value, and the debugger displays the value in the Expressions window. You can attach an expression's value to breakpoints and watchpoints. The debugger evaluates all expressions each time it executes a statement.

    An expression can combine literal values (numbers and character strings), variables, registers, pointers, and C++ object members with operations such as addition, subtraction, logical and, and equality.

    An expression can appear in the Expressions window, the Breakpoints window, or a Memory window. The debugger treats the result of the expression differently, depending on the window in which the expression is displayed.

    This section discusses how expressions are treated and used in the debugger. The topics in this section are:


    How Expressions are Interpreted

    The debugger interprets expressions in various ways, depending on their locations:


    Expressions in the Expressions Window

    The Expressions window displays expressions and their values. To see the value of an expression, place it in the Expressions window. To create a new expression:

    1. Choose Expressions Window from the Window menu.

    If the Expressions window is already open, click it to make it active.

    2. Choose New Expression from the Data menu.

    3. Type a new expression and press Enter/Return.

    The expression's value is displayed in the Value column next to that expression (Figure 11.65). You can also create a new expression by dragging a variable or expression from another window to the Expressions window.
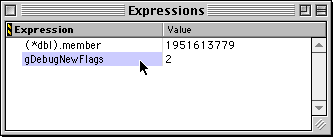
    Figure 11.65 An expression in the Expressions window


    The Expressions window treats all expressions arithmetically: the debugger does not interpret the expression's result as a logical value, as it does in the Breakpoints window.

    For more information, see "Expressions Window" on page 411.


    Expressions in the Breakpoints Window

    You can attach an expression to a breakpoint in the Breakpoints window. The Breakpoints window treats expressions logically rather than arithmetically.

    If the expression yields a false (zero) result, the debugger ignores the breakpoint and continues execution. If the result is true (nonzero), the debugger stops at the breakpoint if the breakpoint is active. To learn how to set a breakpoint, see "Setting and clearing breakpoints" on page 443.

    You can attach an expression to a breakpoint to make the breakpoint conditional on that expression:

    1. Choose Breakpoints Window from the Window menu.

    If the Breakpoints window is already open, click it to make it active.

    2. Set a condition.

    Double-click the condition field for the desired breakpoint and type an expression (Figure 11.66). You can also add or change a breakpoint's condition by dragging an expression from another window and dropping it on the breakpoint's condition.
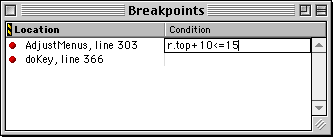
    Figure 11.66 An expression in the Breakpoints window


    A conditional breakpoint stops the program if the expression yields a true (nonzero) result when execution reaches the breakpoint. If the expression produces a false (zero) result, execution continues without stopping.

    For more information, refer to "Breakpoints Window" on page 413 and "Conditional breakpoints" on page 446.


    Expressions in a Memory Window

    In a Memory window, expressions are treated as addresses. The expression in the Display text field at the top of the window defines the base address for the memory displayed in the window. To change a Memory window's base address, follow these steps:

    1. Choose View Memory from the Data menu.

    If a Memory window is already open, click it to make it active.

    2. Enter a new expression.

    Double-click the Display field and type an expression. You can also drag an expression from another window and drop it in the Memory window's Display field.

    The Memory window displays the contents of memory beginning at the address obtained by evaluating the new expression.

    Refer to "Memory Window" on page 418 for more information.


    Using Expressions

    The debugger's expression syntax is similar to that of C/C++, with a few additions and limitations. Pascal style expressions are also supported. The topics discussed include:


    Special Expression Features

    Expressions can refer to specific items:

    yields a false result, because it compares a C string and a Pascal string.

  • (Mac OS) To refer to register values, use the ® symbol and a register name. (Type Option-r to get the ® symbol.)

  • Expression Limitations

    Expressions have the following limitations:


    Listing 11.4 Identical variable names in nested blocks (C++)


    // The debugger cannot distinguish between x the
    // int variable and x the double variable. If x is
    // used in an expression, the debugger will not
    // know which one to use.
    
    
    void f(void)
    	{
    		int x = 0;
    		.
    		.
    		.
    		{
    			double x = 1.0;
    			.
    			.
    			.
    		}
    	}


    Listing 11.5 Type definitions in expressions (C/C++)


    // Use long in expressions; Int32 not available
    typedef long Int32;
    
    
    // Use Rect* in expressions; RectPtr not available
    typedef Rect* RectPtr;


    Listing 11.6 Nested type information (C/C++)


    // To refer to the i member, use Inner.i,
    // not Outer::Inner.i
    
    
    struct Outer
    	{
    		struct Inner
    			{
    				int i;
    			};
    	};


    Example Expressions

    The list below provides example expressions that you can use in any window that uses expressions.

    or

       (*myRectPtr).bottom
  • The value of a class member in an object:
  •    myDrawing::theRect

    Below are examples of logical expressions: the result is considered true if non-zero, false if zero.

  • Is the value of a variable false?
  •    !isDone

    or

       isDone == 0
  • Is the value of a variable true?
  •    isReady

    or

       isReady != 0
  • Is one variable greater than or equal to another?
  •    foo >= bar
  • Is one variable less than both of two others?
  •    (foo < bar) && (foo < car)
  • Is the fourth bit in a character value set to 1?
  •    ((char)foo >> 3) & 0x01
  • Is a C string variable equal to a literal string?
  •    cstr == "Nov shmoz ka pop"
  • Is a Pascal string variable equal to a literal string?
  •    pstr == "\pScram gravy ain't wavy"
  • Always true:
  •    1
  • Always false:
  •    0

    Expression Syntax

    This section defines the debugger's expression syntax. Each listing follows several conventions to make it easier to read:

    For example,


      <name>    identifier
       <qualified-name>

    defines the syntax of a name. A name can be either an identifier or a qualified name; the latter is a syntactic category described in another of the definitions listed in this section.

    The following list describes expression syntax:


      <name>    identifier
       <qualified-name>

      <typedef-name>    identifier

      <class-name>    identifier

      <qualified-name>    <qualified-class-name>::<name>

      <qualified-class-name>    <class-name>
       <class-name>::<qualified-class-name>

      <complete-class-name>    <qualified-class-name>
       :: <qualified-class-name>

      <qualified-type-name>    <typedef-name>
       <class-name>::<qualified-type-name>

      <simple-type-name>    <complete-class-name>
       <qualified-type-name>
       char
       short
       int
       long
       signed
       unsigned
       float
       double
       void

      <ptr-operator>    *
       &

      <type-specifier>    <simple-type-name>

      <type-specifier-list>    <type-specifier> <type-specifier-list>(opt)

      <abstract-declarator>    <ptr-operator> <abstract-declarator>(opt)
       (<abstract-declarator>)

      <type-name>    <type-specifier-list> <abstract-declarator>(opt)

      <literal>    integer-constant
       character-constant
       floating-constant
       string-literal

      <register-name>    ®PC
       ®SP
       ®Dnumber
       ®Anumber

      <register-name>    ®Rnumber
       ®FPRnumber
       ®RTOC

      <register-name>    $PC
       $SP
       $RTOC
       $Anumber

    NOTE

    Registers not targeted by the processor do not display random values for unknown register expressions.

    NOTE

    For specifying a register, the range for number depends on the number of registers available on the target processor.

      <primary-expression>    <literal>
       this
       ::identifier
       ::<qualified-name>
       (<expression>)
       <name>
       <register-name>

      <postfix-expression>    <primary-expression>
       <postfix-expression>[<expression>]
       <postfix-expression>.<name>
       <postfix-expression>-><name>

      <unary-operator>    *
       &
       +
       -
       !
       ~

      <unary-expression>    <postfix-expression>
       <unary-operator> <cast-expression>
       sizeof <unary-expression>
       sizeof(<type-name>)

      <cast-expression>    <unary-expression>
       (<type-name>)<cast-expression>

      <multiplicative-expression>    <cast-expression>
       <multiplicative-expression> * <cast-expression>
       <multiplicative-expression> / <cast-expression>
       <multiplicative-expression> % <cast-expression>

      <additive-expression>    <multiplicative-expression>
       <additive-expression> + <multiplicative-expression>
       <additive-expression> - <multiplicative-expression>

      <shift-expression>    <additive-expression>
       <shift-expression> << <additive-expression>
       <shift-expression> >> <additive-expression>

      <relational-expression>    <shift-expression>
       <relational-expression> < <shift-expression>
       <relational-expression> > <shift-expression>
       <relational-expression> <= <shift-expression>
       <relational-expression> >= <shift-expression>

      <equality-expression>    <relational-expression>
       <equality-expression> == <relational-expression>
       <equality-expression> != <relational-expression>

      <and-expression>    <equality-expression>
       <and-expression> & <equality-expression>

      <exclusive-or-expression>    <and-expression>
       <exclusive-or-expression> ^ <and-expression>

      <inclusive-or-expression>    <exclusive-or-expression>
       <inclusive-or-expression> | <exclusive-or-expression>

      <logical-and-expression>    <inclusive-or-expression>
       <logical-and-expression> && <inclusive-or-expression>

      <logical-or-expression>    <logical-and-expression>
       <logical-or-expression> || <logical-and-expression>

      <conditional-expression>    <logical-or-expression>
       <logical-or-expression> ? <expression> : <conditional-expression>

      <expression>    <conditional-expression>

    Troubleshooting

    This section discusses various problems people have encountered while debugging their programs. There are suggested solutions for each problem.

    The general topics include:


    General Problems

    There may come a time when one of the solutions in this section does not seem to work, or your specific problem is not discussed. The following list details additional steps you can take to try resolving the problem:


    Problems Launching the Debugger

    This section lists questions and problems with launching the debugger.


    The debugger does not launch


    Problem

    Even if Enable Debugger is selected from the Project menu, when I debug my application the debugger does not launch.

    The Run or Debug command in the CodeWarrior Project menu is dimmed.


    Background

    You can launch the debugger automatically from the CodeWarrior IDE only if the project is an application project, the debugger is enabled, and the project is properly configured to generate debugging information.


    Solutions


    The Debug command does nothing


    Problem

    The Debug command does nothing.


    Background

    You must have everything configured properly for the debugger to work correctly. In addition, make sure your code actually does something!


    Solutions


    Errors reported on launch (Mac OS)


    Problem

    I get error -27 when I start debugging and -619 when I quit.


    Background

    You may be using an older version of Ram Doubler that is not compatible with the debugger.


    Solution


    Problems Running/Crashing the Debugger

    This section covers problems that occur while you are running the debugger.


    Project works in the debugger, crashes without


    Problem

    My project works fine when running under the debugger's control. When I run the project without the debugger, my program crashes.


    Background

    Running a program under the debugger changes the operating environment in which the program runs. This can have the strange effect of making an otherwise flawed program work correctly. It is difficult to pinpoint the cause of this problem in your code, but there are two likely factors that can cause the odd behavior.


    Solutions


    Problems with Breakpoints

    This section covers problems related to setting and clearing breakpoints.


    Statements don't have breakpoints


    Problem

    Some statements don't have dashes in the Breakpoint column, making it impossible to set them.


    Background

    The CodeWarrior linkers do not generate symbolics information for source code that is not linked into the final output file. If a statement is never actually used, the linker does not include it in the final object code. You cannot set a breakpoint on such a statement, because the object code does not exist.

    Code optimization may also reorganize the object code extensively, affecting the correspondence between object code and source code and making it difficult or impossible to set breakpoints accurately.


    Solutions


    Breakpoints do not respond


    Problem

    I set a breakpoint, but it does not work.


    Background

    A breakpoint stops execution only if it is reached, it is active, and its condition (if it has one) is true.


    Solutions


    Problems with Variables

    This section covers problems related to variables.


    A variable does not change


    Problem

    I have a variable and I assign it a value, but the value does not change in the debugger.


    Background

    You are not using the variable in the code. As a result, the compiler optimizes the final output file so that the variable is not used.


    Solutions


    Variables are assigned incorrect values


    Problem

    I notice that values seem to be changing incorrectly. I encounter one of these two problems:


    Background

    The compiler has recognized that the variables are not used concurrently, and has given the variables the same storage location. What you are seeing is a kind of automatic compiler optimization called "register coloring." Register coloring checks to see how variables are used in a routine. If two or more variables are in the same scope but are not used at the same time, the compiler may use the same processor register for both variables. Using registers instead of memory to store and manipulate variables improves a program's performance.

    Listing 11.7 is a good example of the kind of code that results in register coloring. Because four different variables are set but never used simultaneously, the compiler has arranged for all four to use the same register. The debugger, however, has no way of knowing that all four variables share the same register, so it shows all four variables changing with each assignment.


    Listing 11.7 Variables changing with register coloring


    void main(void)
    {
    	long a = 0, b = 0, c = 0, d = 0;
    
    
    	a = 1; /* a is set to 1 */
    	a = 2; /* a is set to 2, b remains unchanged */
    	a = 3; /* a is set to 3, c remains unchanged */
    	a = 4; /* a is set to 4, d remains unchanged */
    }


    Solutions


    Strange variable names


    Problem

    The debugger shows variables in the Variables pane or Global Variables window that are not declared in the source code.


    Background

    The compiler often creates its own temporary variables in the object code as it translates source code. These temporary variables have a dollar sign ($) in their names. The debugger also displays C++ virtual base class types with a $ prefix.

    The compiler and linker often add variables from libraries and run-time routines that help initialize and terminate your program.


    Solution


    Strange data types


    Problem

    When I select Show Types from the Data menu, some enumerated values are displayed as having type "?anonx," where x is an arbitrary number.


    Background

    The debugger cannot display the names of enumerated types if the names are not defined in the source code. At compile time, the compiler assigns a generic type name to such enumerated types. It is this generic name that the debugger displays.

    For example, in Listing 11.8, with Show Types selected, variable myMarx is displayed as having the anonymous type ?anonx, because its enumerated type has no name. On the other hand, variable myBeatle is shown with type Beatle, because its enumerated type is defined with that name.


    Listing 11.8 Unnamed enumerated types (C/C++)


    // Debugger displays as anonymous type
    enum {Groucho,
    			Harpo,
    			Chico,
    			Zeppo } myMarx = Harpo;
    
    
    // Debugger displays as type Beatle
    typedef enum Beatle {John,
    										Paul,
    										George,
    										Ringo} myBeatle = John;


    Solution


    Unrecognized data types


    Problem

    I declared my own data type. Why can I not view a variable as that type?


    Background

    The symbolics file includes information only about types that are used in the program. Types defined in typedef statements are not stored in the symbolics file, so you need to view the variable as the type from which it is derived. For example, if you declare a type MyLong based on the long data type, you can view it as a long, but not as a MyLong. For more information, refer to "Viewing data as different types" on page 458.


    Solution


    "undefined identifier" in the Expressions window


    Problem

    A user-defined type in an expression in the Expressions window gives an "· undefined identifier ·" value.


    Background

    The debugger does not recognize data types that are simply aliases of another type, because such alias types are not included in the symbolics file.

    For example, given the Pascal type declaration


      TYPE    MYBIGINT = LONGINT;

    the expression


      MYBIGINT(thePtr)

    in the debugger's Expressions window will display its value as "· undefined identifier ·." To get the correct result, use the following expression instead:


      LONGINT(thePtr)

    To learn more, see "Expression Limitations" on page 469.


    Solution


    Problems with Source Files

    This section covers problems related to source-code files.


    No source-code view


    Problem

    All I see in the source pane is assembly-language code. The Source pop-up menu does not let me display source code.


    Background

    There is no symbolics information available for that code. You may not have enabled debugging for a file, or you may be stepping through some ancillary code added by the linker that has no corresponding source code (for example, glue code). Without symbolics information, the debugger can only display the code in assembly language.


    Solutions


    Outdated source files


    Problem

    When I run my project, I get a warning that says the modification dates do not match.


    Background

    The symbolics file keeps track of when the source file on which it is based was last changed. If the date and time stored in the symbolics file do not match those of the original file, the debugger warns you that the symbolics information may no longer be current.


    Solution


    Spurious ANSI C code in Pascal projects


    Problem

    I am working on a Pascal program, and when I step through code I find ANSI C routines. I have not included any ANSI C libraries.


    Background

    The Pascal runtime library was written in C and uses ANSI C routines. These are the routines that are displayed when debugging a Pascal program.


    Solution


    Debugger Error Messages

    The following is a list of error messages that you may receive from the debugger, with some hints about the possible causes or circumstances of the error. Messages listed without comment are self-explanatory.


    An unknown error occurred while trying to target an existing process.


    Bad type code

    Internal error.


    Bus Error

    Attempt to read or write to an invalid address.


    can't display value -- type information not supported

    The symbolics file contains a data type that the debugger does not support.


    Can't use this source file, it was not saved before running, or was edited after linking.

    The debugger does not have access to the same text available to the compiler. The debugger just issues a warning unless the debugging information references nonexistent text, in which case it gives you this error message.


    class name expected

    Unexpectedly encountered something other than a class name while evaluating an expression.


    Could not complete your request because the process is not suspended.

    The command you issued cannot be performed while the program is running.


    Could not set a watch point because the page containing that memory location overlaps low memory or the system heap.

    Watchpoints cannot be set in low memory or in the system heap.


    Could not set a watch point because the page containing that memory location overlaps the stack.

    Watchpoints are implemented via the memory write-protection mechanism, which operates at the page level. You cannot write-protect a page of memory containing part of the stack.


    Couldn't locate the program entry point, program will not stop on launch.

    When launching a program, the debugger normally sets an implicit breakpoint at the beginning of the function named main() (in C/C++) or the main program (in Pascal). If the debugger cannot find such a routine, it just launches the program without suspending that program's execution.


    identified or qualified name expected

    Unexpectedly encountered something other than an indentifier or qualified name while evaluating an expression.


    illegal character constant

    Invalid character constant encountered while evaluating an expression.


    illegal string constant

    Invalid string constant encountered while evaluating an expression.


    illegal token

    Invalid token encountered while evaluating an expression.


    Invalid C or Pascal string.

    An ill-formed string was encountered in evaluating an expression.


    Invalid character constant.

    An invalid character constant was encountered in evaluating an expression.


    Invalid escape sequence inside string or character constant.

    C/C++ escape sequence in a string was not valid syntax.


    invalid pointer or reference expression

    Invalid pointer or reference expression encountered while evaluating an expression.


    invalid type declaration

    Invalid type encountered while evaluating an expression.


    invalid type information in SYM file

    The debugger is unable to display a variable because of bad data in the symbolics file.


    New variable value is too large for the destination variable.

    For example, you have attempted to assign a 20-byte string to a 10-byte string variable.


    No type with that name exists.

    The debugger does not recognize a type name you have entered in the View As dialog box.


    Register not available

    The debugger is unable to get a valid register value to display a register variable. For example, when looking at routines up the stack from the current routine, the debugger cannot retrieve the saved register values unless all routines below it on the stack have debugging information.


    string too long

    String exceeds maximum permissible length.


    The new variable value is the wrong type for the destination variable.

    You have attempted to assign a value of the wrong type to a variable, such as a string to an integer variable.


    typedef name expected

    Unexpectedly encountered something other than a typedef name while evaluating an expression.


    Unable to step from here.

    The debugger cannot step execution from this point.


    Unable to step out from here.

    The debugger cannot step out from this point.


    undefined identifier

    Undefined identifier encountered while evaluating an expression.


    unexpected token

    Unexpected token encountered while evaluating an expression.


    unknown error "^0"

    An internal error that was not expected to reach the user.


    unterminated comment

    A closing comment bracket is missing.


    Variable or expression cannot be used as an address.

    For example, if r is a Rect, *(char*)r is invalid.


    Warning - this SYM file has some invalid or inconsistent data. The debugger may show incorrect information.

    Your symbolics file may have been corrupted.


    '*' or '&' expected

    Unexpectedly encountered something other than a pointer or reference operator while evaluating an expression.


    Visit the Metrowerks website at: http://www.metrowerks.com
    For assistance contact Metrowerks Technical Support at: support@metrowerks.com
    Copyright © 1999, Metrowerks Corp. All rights reserved.

    Last updated: May 24, 1999 * Chris Magnuson * John Roseborough